
SL Paper 1
The ticket prices for a concert are shown in the following table.

- A total of tickets were sold.
- The total amount of money from ticket sales was .
- There were twice as many adult tickets sold as child tickets.
Let the number of adult tickets sold be , the number of child tickets sold be , and the number of student tickets sold be .
Write down three equations that express the information given above.
Find the number of each type of ticket sold.
The strength of earthquakes is measured on the Richter magnitude scale, with values typically between and where is the most severe.
The Gutenberg–Richter equation gives the average number of earthquakes per year, , which have a magnitude of at least . For a particular region the equation is
, for some .
This region has an average of earthquakes per year with a magnitude of at least .
The equation for this region can also be written as .
The expected length of time, in years, between earthquakes with a magnitude of at least is .
Within this region the most severe earthquake recorded had a magnitude of .
Find the value of .
Find the value of .
Given , find the range for .
Find the expected length of time between this earthquake and the next earthquake of at least this magnitude. Give your answer to the nearest year.
Let the function represent the height in centimetres of a cylindrical tin can with diameter .
for .
The function is the inverse function of .
Find the range of .
Find .
In the context of the question, interpret your answer to part (b)(i).
Write down the range of .
Charlie and Daniella each began a fitness programme. On day one, they both ran . On each subsequent day, Charlie ran more than the previous day whereas Daniella increased her distance by of the distance ran on the previous day.
Calculate how far
Charlie ran on day of his fitness programme.
Daniella ran on day of her fitness programme.
On day of the fitness programmes Daniella runs more than Charlie for the first time.
Find the value of .
Consider the function . The graph of is shown in the diagram. The vertex of the graph has coordinates . The graph intersects the -axis at two points, and .

Find the value of .
Find the value of
(i) .
(ii) .
(iii) .
Write down the equation of the axis of symmetry of the graph.
A factory produces engraved gold disks. The cost of the disks is directly proportional to the cube of the radius of the disk.
A disk with a radius of cm costs US dollars (USD).
Find an equation which links and .
Find, to the nearest USD, the cost of disk that has a radius of cm.
The height of a baseball after it is hit by a bat is modelled by the function
where is the height in metres above the ground and is the time in seconds after the ball was hit.
Write down the height of the ball above the ground at the instant it is hit by the bat.
Find the value of when the ball hits the ground.
State an appropriate domain for in this model.
Let . The following diagram shows part of the graph of .

The function can be written in the form .
Find the equation of the axis of symmetry of the graph of .
Write down the value of .
Find the value of .
The graph of a second function, , is obtained by a reflection of the graph of in the -axis, followed by a translation of .
Find the coordinates of the vertex of the graph of .
Sejah placed a baking tin, that contained cake mix, in a preheated oven in order to bake a cake. The temperature in the centre of the cake mix, , in degrees Celsius (°C) is given by
where is the time, in minutes, since the baking tin was placed in the oven. The graph of is shown in the following diagram.

The temperature in the centre of the cake mix was 18 °C when placed in the oven.
The baking tin is removed from the oven 15 minutes after the temperature in the centre of the cake mix has reached 130 °C.
Write down what the value of 150 represents in the context of the question.
Find the value of .
Find the total time that the baking tin is in the oven.
The following diagram shows part of the graph of with -intercept (5, 0) and -intercept (0, 8).

Find the -intercept of the graph of .
Find the -intercept of the graph of .
Find the -intercept of the graph of .
Describe the transformation .
A quadratic function is given by . The points and lie on the graph of .
The -coordinate of the minimum of the graph is 3.
Find the value of and of .
The size of a computer screen is the length of its diagonal. Zuzana buys a rectangular computer screen with a size of 68 cm, a height of cm and a width of cm, as shown in the diagram.

The ratio between the height and the width of the screen is 3:4.
Use this information to write down an equation involving and .
Use this ratio to write down in terms of .
Find the value of and of .
Let f(x) = ax2 − 4x − c. A horizontal line, L , intersects the graph of f at x = −1 and x = 3.
The equation of the axis of symmetry is x = p. Find p.
Hence, show that a = 2.
Jashanti is saving money to buy a car. The price of the car, in US Dollars (USD), can be modelled by the equation
Jashanti’s savings, in USD, can be modelled by the equation
In both equations is the time in months since Jashanti started saving for the car.
Jashanti does not want to wait too long and wants to buy the car two months after she started saving. She decides to ask her parents for the extra money that she needs.
Write down the amount of money Jashanti saves per month.
Use your graphic display calculator to find how long it will take for Jashanti to have saved enough money to buy the car.
Calculate how much extra money Jashanti needs.
Olava’s Pizza Company supplies and delivers large cheese pizzas.
The total cost to the customer, , in Papua New Guinean Kina (), is modelled by the function
where , is the number of large cheese pizzas ordered. This total cost includes a fixed cost for delivery.
State, in the context of the question, what the value of represents.
State, in the context of the question, what the value of represents.
Write down the minimum number of pizzas that can be ordered.
Kaelani has .
Find the maximum number of large cheese pizzas that Kaelani can order from Olava’s Pizza Company.
The price of gas at Leon’s gas station is per litre. If a customer buys a minimum of litres, a discount of is applied.
This can be modelled by the following function, , which gives the total cost when buying a minimum of litres at Leon’s gas station.
where is the number of litres of gas that a customer buys.
Find the total cost of buying litres of gas at Leon’s gas station.
Find .
The price of gas at Erica’s gas station is per litre. A customer must buy a minimum of litres of gas. The total cost at Erica’s gas station is cheaper than Leon’s gas station when .
Find the minimum value of .
The size of the population of migrating birds in a particular town can be approximately modelled by the equation , where is measured in months from the time of the initial measurements.
In a month period the maximum population is and occurs when and the minimum population is and occurs when .
This information is shown on the graph below.

Find the value of .
Find the value of .
Find the value of .
Find the value of at which the population first reaches .
Irina uses a set of coordinate axes to draw her design of a window. The base of the window is on the -axis, the upper part of the window is in the form of a quadratic curve and the sides are vertical lines, as shown on the diagram. The curve has end points and and its vertex is . Distances are measured in centimetres.

The quadratic curve can be expressed in the form for .
Write down the value of .
Hence form two equations in terms of and .
Hence find the equation of the quadratic curve.
Find the area of the shaded region in Irina’s design.
Consider the curve y = 5x3 − 3x.
The curve has a tangent at the point P(−1, −2).
Find .
Find the gradient of this tangent at point P.
Find the equation of this tangent. Give your answer in the form y = mx + c.
Consider the function .
Find f'(x)
Find the gradient of the graph of f at .
Find the x-coordinate of the point at which the normal to the graph of f has gradient .
Elvis Presley is an extremely popular singer. Although he passed away in , many of his fans continue to pay tribute by dressing like Elvis and singing his songs.
The number of Elvis impersonators, , can be modelled by the function
where , is the number of years since .
Write down the number of Elvis impersonators in .
Calculate the time taken for the number of Elvis impersonators to reach .
Calculate the number of Elvis impersonators when .
The world population in is projected to be people.
Use this information to explain why the model for the number of Elvis impersonators is unrealistic.
The diagram shows the graph of the quadratic function , with vertex .

The equation has two solutions. One of these solutions is .
Write down the other solution of .
Complete the table below placing a tick (✔) to show whether the unknown parameters and are positive, zero or negative. The row for has been completed as an example.

State the values of for which is decreasing.
If a shark is spotted near to Brighton beach, a lifeguard will activate a siren to warn swimmers.

The sound intensity, , of the siren varies inversely with the square of the distance, , from the siren, where .
It is known that at a distance of metres from the siren, the sound intensity is watts per square metre ().
Show that .
Sketch the curve of on the axes below showing clearly the point .

Whilst swimming, Scarlett can hear the siren only if the sound intensity at her location is greater than .
Find the values of where Scarlett cannot hear the siren.
A function is given by .
Write down the derivative of .
Find the point on the graph of at which the gradient of the tangent is equal to 6.
Maria owns a cheese factory. The amount of cheese, in kilograms, Maria sells in one week, , is given by
,
where is the price of a kilogram of cheese in euros (EUR).
Maria earns for each kilogram of cheese sold.
To calculate her weekly profit , in EUR, Maria multiplies the amount of cheese she sells by the amount she earns per kilogram.
Write down how many kilograms of cheese Maria sells in one week if the price of a kilogram of cheese is 8 EUR.
Find how much Maria earns in one week, from selling cheese, if the price of a kilogram of cheese is 8 EUR.
Write down an expression for in terms of .
Find the price, , that will give Maria the highest weekly profit.
The following function models the growth of a bacteria population in an experiment,
P(t) = A × 2t, t ≥ 0
where A is a constant and t is the time, in hours, since the experiment began.
Four hours after the experiment began, the bacteria population is 6400.
Find the value of A.
Interpret what A represents in this context.
Find the time since the experiment began for the bacteria population to be equal to 40A.
The cross-section of an arched entrance into the ballroom of a hotel is in the shape of a parabola. This cross-section can be modelled by part of the graph , where is the height of the archway, in metres, at a horizontal distance, metres, from the point , in the bottom corner of the archway.

To prepare for an event, a square-based crate that is wide and high is to be moved through the archway into the ballroom. The crate must remain upright while it is being moved.
Determine an equation for the axis of symmetry of the parabola that models the archway.
Determine whether the crate will fit through the archway. Justify your answer.
Little Green island originally had no turtles. After 55 turtles were introduced to the island, their population is modelled by
where is a constant and is the time in years since the turtles were introduced.
Find the value of .
Find the time, in years, for the population to decrease to 20 turtles.
There is a number beyond which the turtle population will not decrease.
Find the value of . Justify your answer.
Consider the following graphs of quadratic functions.

The equation of each of the quadratic functions can be written in the form , where .
Each of the sets of conditions for the constants , and , in the table below, corresponds to one of the graphs above.
Write down the number of the corresponding graph next to each set of conditions.

A factory produces shirts. The cost, C, in Fijian dollars (FJD), of producing x shirts can be modelled by
C(x) = (x − 75)2 + 100.
The cost of production should not exceed 500 FJD. To do this the factory needs to produce at least 55 shirts and at most s shirts.
Find the cost of producing 70 shirts.
Find the value of s.
Find the number of shirts produced when the cost of production is lowest.
The graph below shows the average savings, thousand dollars, of a group of university graduates as a function of , the number of years after graduating from university.

The equation of the model can be expressed in the form , where and are real constants.
The graph of the model must pass through the following four points.

A negative value of indicates that a graduate is expected to be in debt.
Write down one feature of this graph which suggests a cubic function might be appropriate to model this scenario.
Write down the value of .
Write down three simultaneous equations for and .
Hence, or otherwise, find the values of and .
Use the model to determine the total length of time, in years, for which a graduate is expected to be in debt after graduating from university.
Let .
The function can also be expressed in the form .
Find the equation of the axis of symmetry of the graph of .
(i) Write down the value of .
(ii) Find the value of .
The function is of the form , where , and are positive integers.
Part of the graph of is shown on the axes below. The graph of the function has its local maximum at and its local minimum at .

Write down the domain of the function.
Draw the line on the axes.
Write down the number of solutions to .
Find the range of values of for which has no solution.
Professor Wei observed that students have difficulty remembering the information presented in his lectures.
He modelled the percentage of information retained, , by the function , , where is the number of days after the lecture.
He found that day after a lecture, students had forgotten of the information presented.
Based on his model, Professor Wei believes that his students will always retain some information from his lecture.
Find the value of .
Use this model to find the percentage of information retained by his students hours after Professor Wei’s lecture.
State a mathematical reason why Professor Wei might believe this.
Write down one possible limitation of the domain of the model.
Professor Vinculum investigated the migration season of the Bulbul bird from their natural wetlands to a warmer climate.
He found that during the migration season their population, could be modelled by , ≥ 0 , where is the number of days since the start of the migration season.
Find the population of the Bulbul birds at the start of the migration season.
Find the population of the Bulbul birds after 5 days.
Calculate the time taken for the population to decrease below 1400.
According to this model, find the smallest possible population of Bulbul birds during the migration season.
The amount, in milligrams, of a medicinal drug in the body hours after it was injected is given by . Before this injection, the amount of the drug in the body was zero.
Write down
the initial dose of the drug.
the percentage of the drug that leaves the body each hour.
Calculate the amount of the drug remaining in the body hours after the injection.
In an experiment, a number of fruit flies are placed in a container. The population of fruit flies, P , increases and can be modelled by the function
where t is the number of days since the fruit flies were placed in the container.
Find the number of fruit flies which were placed in the container.
Find the number of fruit flies that are in the container after 6 days.
The maximum capacity of the container is 8000 fruit flies.
Find the number of days until the container reaches its maximum capacity.
The graph of the quadratic function intersects the -axis at the point and has its vertex at the point .

Find the value of .
The amount of yeast, g grams, in a sugar solution can be modelled by the function,
g(t) = 10 − k(c−t) for t ≥ 0
where t is the time in minutes.
The graph of g(t) is shown.

The initial amount of yeast in this solution is 2 grams.
The amount of yeast in this solution after 3 minutes is 9 grams.
Write down the maximum amount of yeast in this solution.
Consider the quadratic function .
The equation of the line of symmetry of the graph .
The graph intersects the x-axis at the point (−2 , 0).
Using only this information, write down an equation in terms of a and b.
Using this information, write down a second equation in terms of a and b.
Hence find the value of a and of b.
The graph intersects the x-axis at a second point, P.
Find the x-coordinate of P.
A function is defined by for .
Find the range of .
Find the value of .
The following diagram shows the graph of a function , for −4 ≤ x ≤ 2.

On the same axes, sketch the graph of .
Another function, , can be written in the form . The following diagram shows the graph of .

Write down the value of a and of b.
Consider the graph of the function .

Write down the zero of .
Write down the coordinates of the local minimum point.
Consider the function .
Solve .
Consider the function .
Line is a tangent to at the point .
Find .
Use your answer to part (a) to find the gradient of .
Determine the number of lines parallel to that are tangent to . Justify your answer.
Dilara is designing a kite on a set of coordinate axes in which one unit represents .
The coordinates of , and are and respectively. Point lies on the -axis. is perpendicular to . This information is shown in the following diagram.

Find the gradient of the line through and .
Write down the gradient of the line through and .
Find the equation of the line through and . Give your answer in the form , where and are integers.
Write down the -coordinate of point .
Let , where p ≠ 0. Find Find the number of roots for the equation .
Justify your answer.
Gabriella purchases a new car.
The car’s value in dollars, , is modelled by the function
where is the number of years since the car was purchased and is a constant.
After two years, the car’s value is $9143.20.
This model is defined for . At years the car’s value will be zero dollars.
Write down, and simplify, an expression for the car’s value when Gabriella purchased it.
Find the value of .
Find the value of .
Natasha carries out an experiment on the growth of mould. She believes that the growth can be modelled by an exponential function
,
where is the area covered by mould in , is the time in days since the start of the experiment and and are constants.
The area covered by mould is at the start of the experiment and after days.
Write down the value of .
Find the value of .
The coordinates of point A are and the coordinates of point B are . Point M is the midpoint of AB.
is the line through A and B.
The line is perpendicular to and passes through M.
Write down, in the form , the equation of .
The intensity level of sound, measured in decibels (dB), is a function of the sound intensity, watts per square metre (W m−2). The intensity level is given by the following formula.
, ≥ 0.
An orchestra has a sound intensity of 6.4 × 10⁻³ W m−2 . Calculate the intensity level, of the orchestra.
A rock concert has an intensity level of 112 dB. Find the sound intensity, .
The pH of a solution measures its acidity and can be determined using the formula pH , where is the concentration of hydronium ions in the solution, measured in moles per litre. A lower pH indicates a more acidic solution.
The concentration of hydronium ions in a particular type of coffee is moles per litre.
A different, unknown, liquid has times the concentration of hydronium ions of the coffee in part (a).
Calculate the pH of the coffee.
Determine whether the unknown liquid is more or less acidic than the coffee. Justify your answer mathematically.
The diagram shows part of the graph of a function . The graph passes through point .
The tangent to the graph of at A has equation . Let be the normal to the graph of at A.
Write down the value of .
Find the equation of . Give your answer in the form where , , .
Draw the line on the diagram above.
Consider the straight lines L1 and L2 . R is the point of intersection of these lines.

The equation of line L1 is y = ax + 5.
The equation of line L2 is y = −2x + 3.
Find the value of a.
Find the coordinates of R.
Line L3 is parallel to line L2 and passes through the point (2, 3).
Find the equation of line L3. Give your answer in the form y = mx + c.
In this question, give your answers to the nearest whole number.
Criselda travelled to Kota Kinabalu in Malaysia. At the airport, she saw the following information at the Currency Exchange counter.

This means the Currency Exchange counter would buy from a traveller and in exchange return at a rate of . There is no commission charged.
Criselda changed to .
Calculate the amount of that Criselda received.
While in Kota Kinabalu, Criselda spent . She returned to the Currency Exchange counter and changed the remainder of her into .
Calculate the amount of she received.
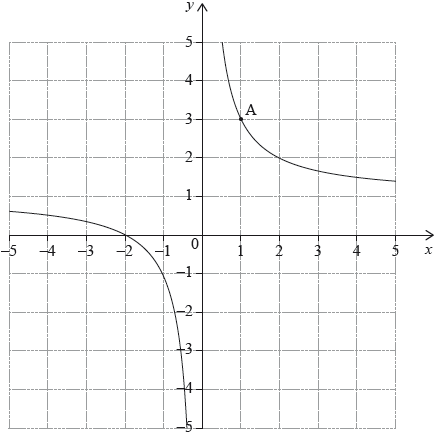
Consider the graph of the function .
Write down the equation of the vertical asymptote.
Write down the equation of the horizontal asymptote.
Calculate the value of x for which f(x) = 0 .
The following diagram shows part of the graph of , for .
Let be any point on the graph of . Line is the tangent to the graph of at .

Line intersects the -axis at point and the -axis at point B.
Find in terms of and .
Show that the equation of is .
Find the area of triangle in terms of .
The graph of is translated by to give the graph of .
In the following diagram:
- point lies on the graph of
- points , and lie on the vertical asymptote of
- points and lie on the horizontal asymptote of
- point lies on the -axis such that is parallel to .
Line is the tangent to the graph of at , and passes through and .

Given that triangle and rectangle have equal areas, find the gradient of in terms of .
M-Line is a company that prints and sells custom designs on T-shirts. For each order, they charge an initial design fee and then an additional fee for each printed T-shirt.
M-Line charges euros per order. This charge is modelled by the linear function , where is the number of T-shirts in the order.
EnYear is another company that prints and sells T-shirts. The price, euros, that they charge for an order can be modelled by the linear function , where is the number of T-shirts in the order.
Write down the initial design fee charged for each order.
Find the total amount charged for an order of T-shirts.
Write down the number of T-shirts in an order for which EnYear charged euros.
An order of T-shirts will be charged the same price by both M-Line and EnYear.
Find the value of .
Jean-Pierre jumps out of an airplane that is flying at constant altitude. Before opening his parachute, he goes through a period of freefall.
Jean-Pierre’s vertical speed during the time of freefall, , in , is modelled by the following function.
where , is the number of seconds after he jumps out of the airplane, and is a constant. A sketch of Jean-Pierre’s vertical speed against time is shown below.

Jean-Pierre’s initial vertical speed is .
Find the value of .
In the context of the model, state what the horizontal asymptote represents.
Find Jean-Pierre’s vertical speed after seconds. Give your answer in .
Three towns, , and are represented as coordinates on a map, where the and axes represent the distances east and north of an origin, respectively, measured in kilometres.
Town is located at and town is located at . A road runs along the perpendicular bisector of . This information is shown in the following diagram.

Find the equation of the line that the road follows.
Town is due north of town and the road passes through town .
Find the -coordinate of town .
The graph of a quadratic function has -intercept 10 and one of its -intercepts is 1.
The -coordinate of the vertex of the graph is 3.
The equation of the quadratic function is in the form .
Write down the value of .
Find the value of and of .
Write down the second -intercept of the function.
Line intersects the -axis at point A and the -axis at point B, as shown on the diagram.

The length of line segment OB is three times the length of line segment OA, where O is the origin.
Point lies on .
Find the gradient of .
Find the equation of in the form .
Find the -coordinate of point A.
A potter sells vases per month.
His monthly profit in Australian dollars (AUD) can be modelled by
Find the value of if no vases are sold.
Differentiate .
In this question, give all answers to two decimal places.
Karl invests 1000 US dollars (USD) in an account that pays a nominal annual interest of 3.5%, compounded quarterly. He leaves the money in the account for 5 years.
Calculate the amount of money he has in the account after 5 years.
Write down the amount of interest he earned after 5 years.
Karl decides to donate this interest to a charity in France. The charity receives 170 euros (EUR). The exchange rate is 1 USD = t EUR.
Calculate the value of t.
Consider a function f (x) , for −2 ≤ x ≤ 2 . The following diagram shows the graph of f.

On the grid above, sketch the graph of f −1.
Let and , for , where is a constant.
Find .
Given that , find the value of .